
Augusta County Market Report
April 2025
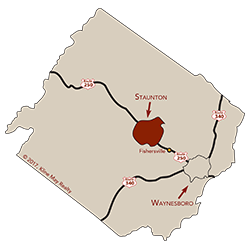
Staunton, Waynesboro, and Augusta County
Units Sold
Year to Date
Year to Date
478
+10.39%
+10.39%
12 Month
Residential Sales
Residential Sales
1,553
+4.72%
+4.72%
12 Month
Avg Sales Price
Avg Sales Price
$353,055
+6.10%
+6.10%
Months Supply
of Inventory
of Inventory
1.67 m
+7.99%
+7.99%
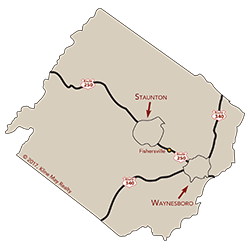
City of Staunton
Units Sold
Year to Date
Year to Date
112
-14.50%
-14.50%
12 Month
Residential Sales
Residential Sales
420
+6.87%
+6.87%
12 Month
Avg Sales Price
Avg Sales Price
$317,624
+5.53%
+5.53%
Months Supply
of Inventory
of Inventory
1.29 m
-24.81%
-24.81%
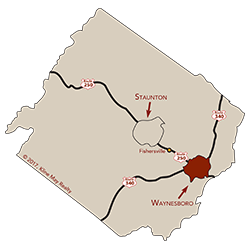
City of Waynesboro
Units Sold
Year to Date
Year to Date
116
+18.37%
+18.37%
12 Month
Residential Sales
Residential Sales
402
+5.24%
+5.24%
12 Month
Avg Sales Price
Avg Sales Price
$315,553
+3.02%
+3.02%
Months Supply
of Inventory
of Inventory
1.43 m
+38.22%
+38.22%
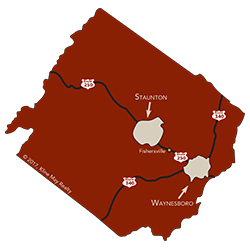
Augusta County
Units Sold
Year to Date
Year to Date
250
+22.50%
+22.50%
12 Month
Residential Sales
Residential Sales
731
+3.25%
+3.25%
12 Month
Avg Sales Price
Avg Sales Price
$394,035
+8.05%
+8.05%
Months Supply
of Inventory
of Inventory
2.02 m
+16.79%
+16.79%
What This Chart Shows:
Residential home sales by month, since 2013. This chart helps show seasonal trends in home sales.
What This Chart Shows:
The number of residential properties on which Buyers and Sellers entered into contracts each month. This is an excellent indicator of future sales.
What This Chart Shows:
The past twelve months sales, for this month and each month since 2010. This is one of the best ways to see the true long term trend in the market.
What This Chart Shows:
The long term trend in average and median sales prices for homes.